Research update · CEC-2013 LSGO, D=1000
Subspace optimization is a specialist, not a general improvement
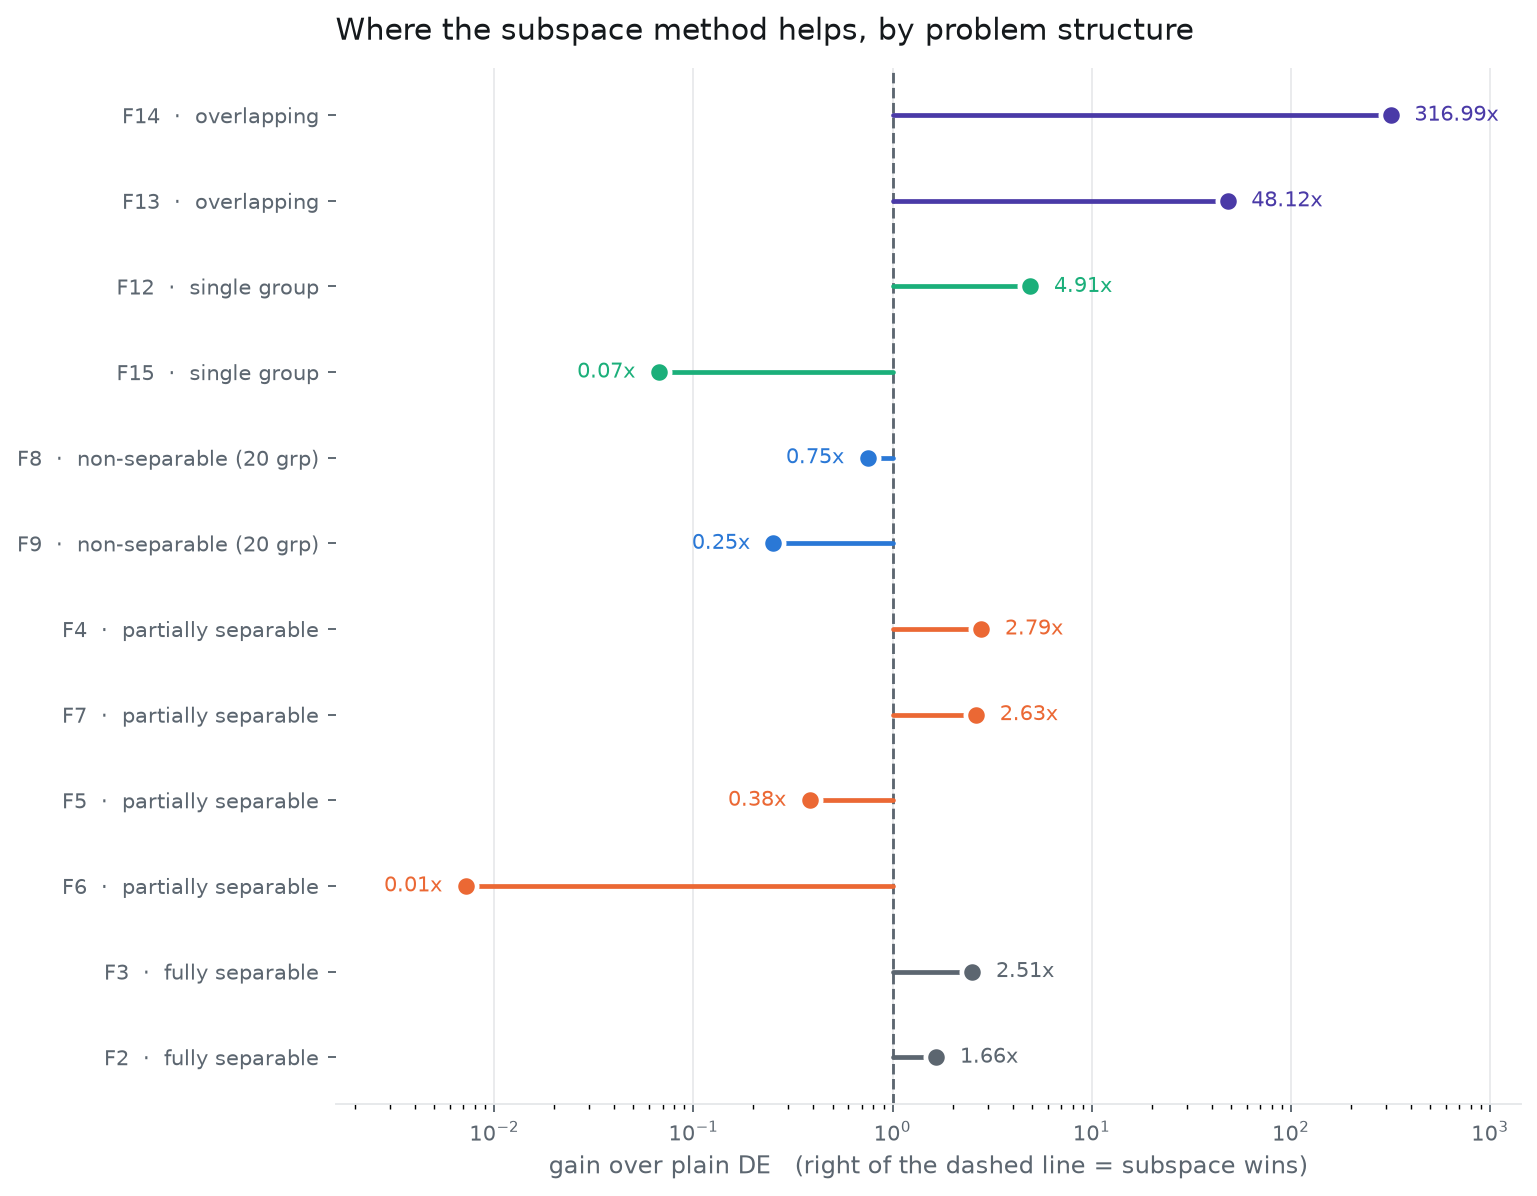
Measured against plain Differential Evolution, the dual-EA subspace method loses on most problem classes and wins by roughly 50× on overlapping structure. That pattern is the finding. It tells us which problems the method is actually for.
Where it helps
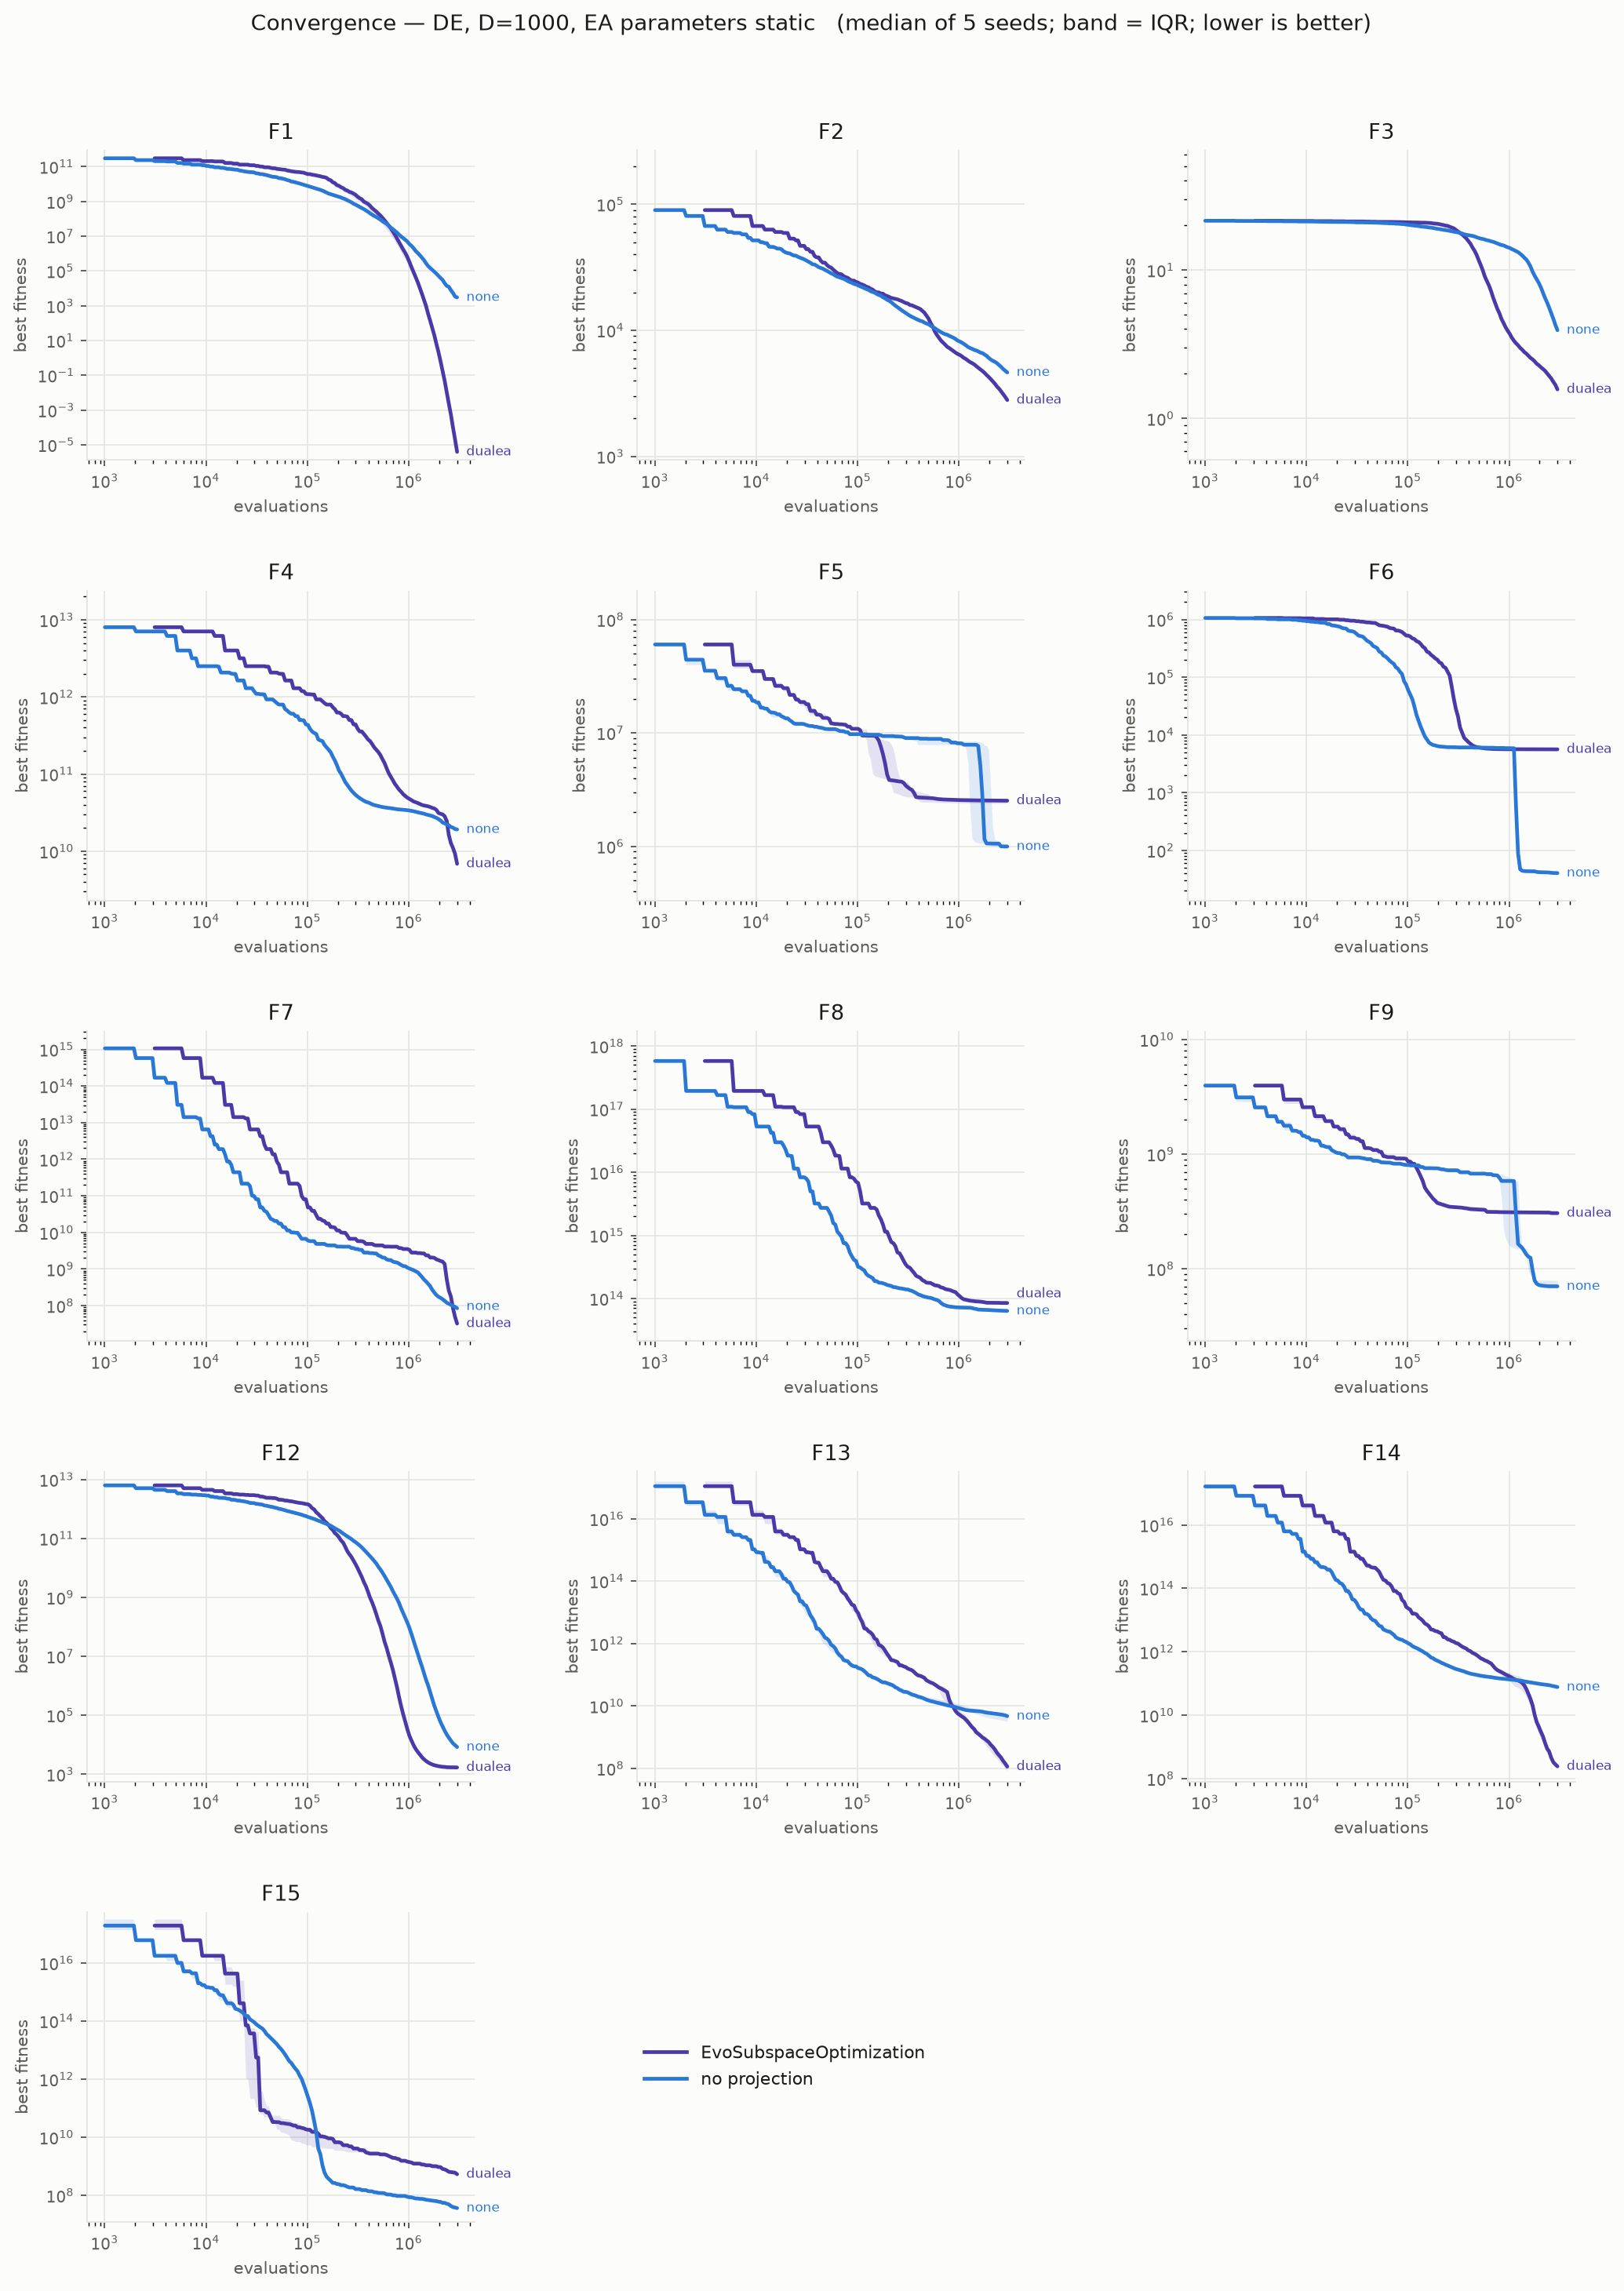
Every run below is 3 million evaluations at D=1000. The parent is plain DE with no projection and static parameters (F=0.5, CR=0.9); the subspace arm is the dual-EA with LoRA rank 1, same optimizer, same budget, same seeds.
| Function | Structure | plain DE | subspace | gain | seeds |
|---|---|---|---|---|---|
| F1 | fully separable (alignment artifact) | 3.439e+03 | 5.309e-06 | 6.5e+08x | 5 |
| F13 | overlapping | 5.027e+09 | 1.045e+08 | 48.1x | 5 |
| F12 | single group | 8.324e+03 | 2.163e+03 | 3.85x | 1 |
| F4 | partially separable | 1.910e+10 | 6.848e+09 | 2.79x | 1 |
| F3 | fully separable | 3.936e+00 | 1.565e+00 | 2.51x | 1 |
| F2 | fully separable | 4.794e+03 | 2.682e+03 | 1.79x | 1 |
| F5 | partially separable | 1.011e+06 | 2.640e+06 | 0.383x | 5 |
| F9 | non-separable (20 grp) | 7.393e+07 | 2.931e+08 | 0.252x | 5 |
| F15 | single group | 3.718e+07 | 5.552e+08 | 0.067x | 5 |
| F6 | partially separable | 4.030e+01 | 5.610e+03 | 0.00718x | 1 |
Aggregated by structural class
| Class | geo-mean gain | functions |
|---|---|---|
| overlapping | 48.12x | 1 |
| fully separable | 2.12x | 2 |
| single group | 0.51x | 2 |
| non-separable (20 grp) | 0.25x | 1 |
| partially separable | 0.20x | 3 |
The overlapping functions are the only class where the method wins. Overlapping problems share variables between subcomponents, so improving one component requires moving several together. That is the kind of coordinated move a low-rank step can make and a coordinate-wise local search cannot.
Is it this map, or any map of the same size?
All three projections searched at the same 64 numbers, same dual-EA scheme, same budget and seeds. If any reduction of that size performed alike, the structure of the map would be irrelevant and there would be nothing to study.
| Function | LoRA r=1 | random projection | random blocking | seeds |
|---|---|---|---|---|
| F1 | 4.139e-06 | 8.748e+06 | 8.383e+06 | 2 |
The map matters: at identical search dimension the three are not interchangeable.
Convergence
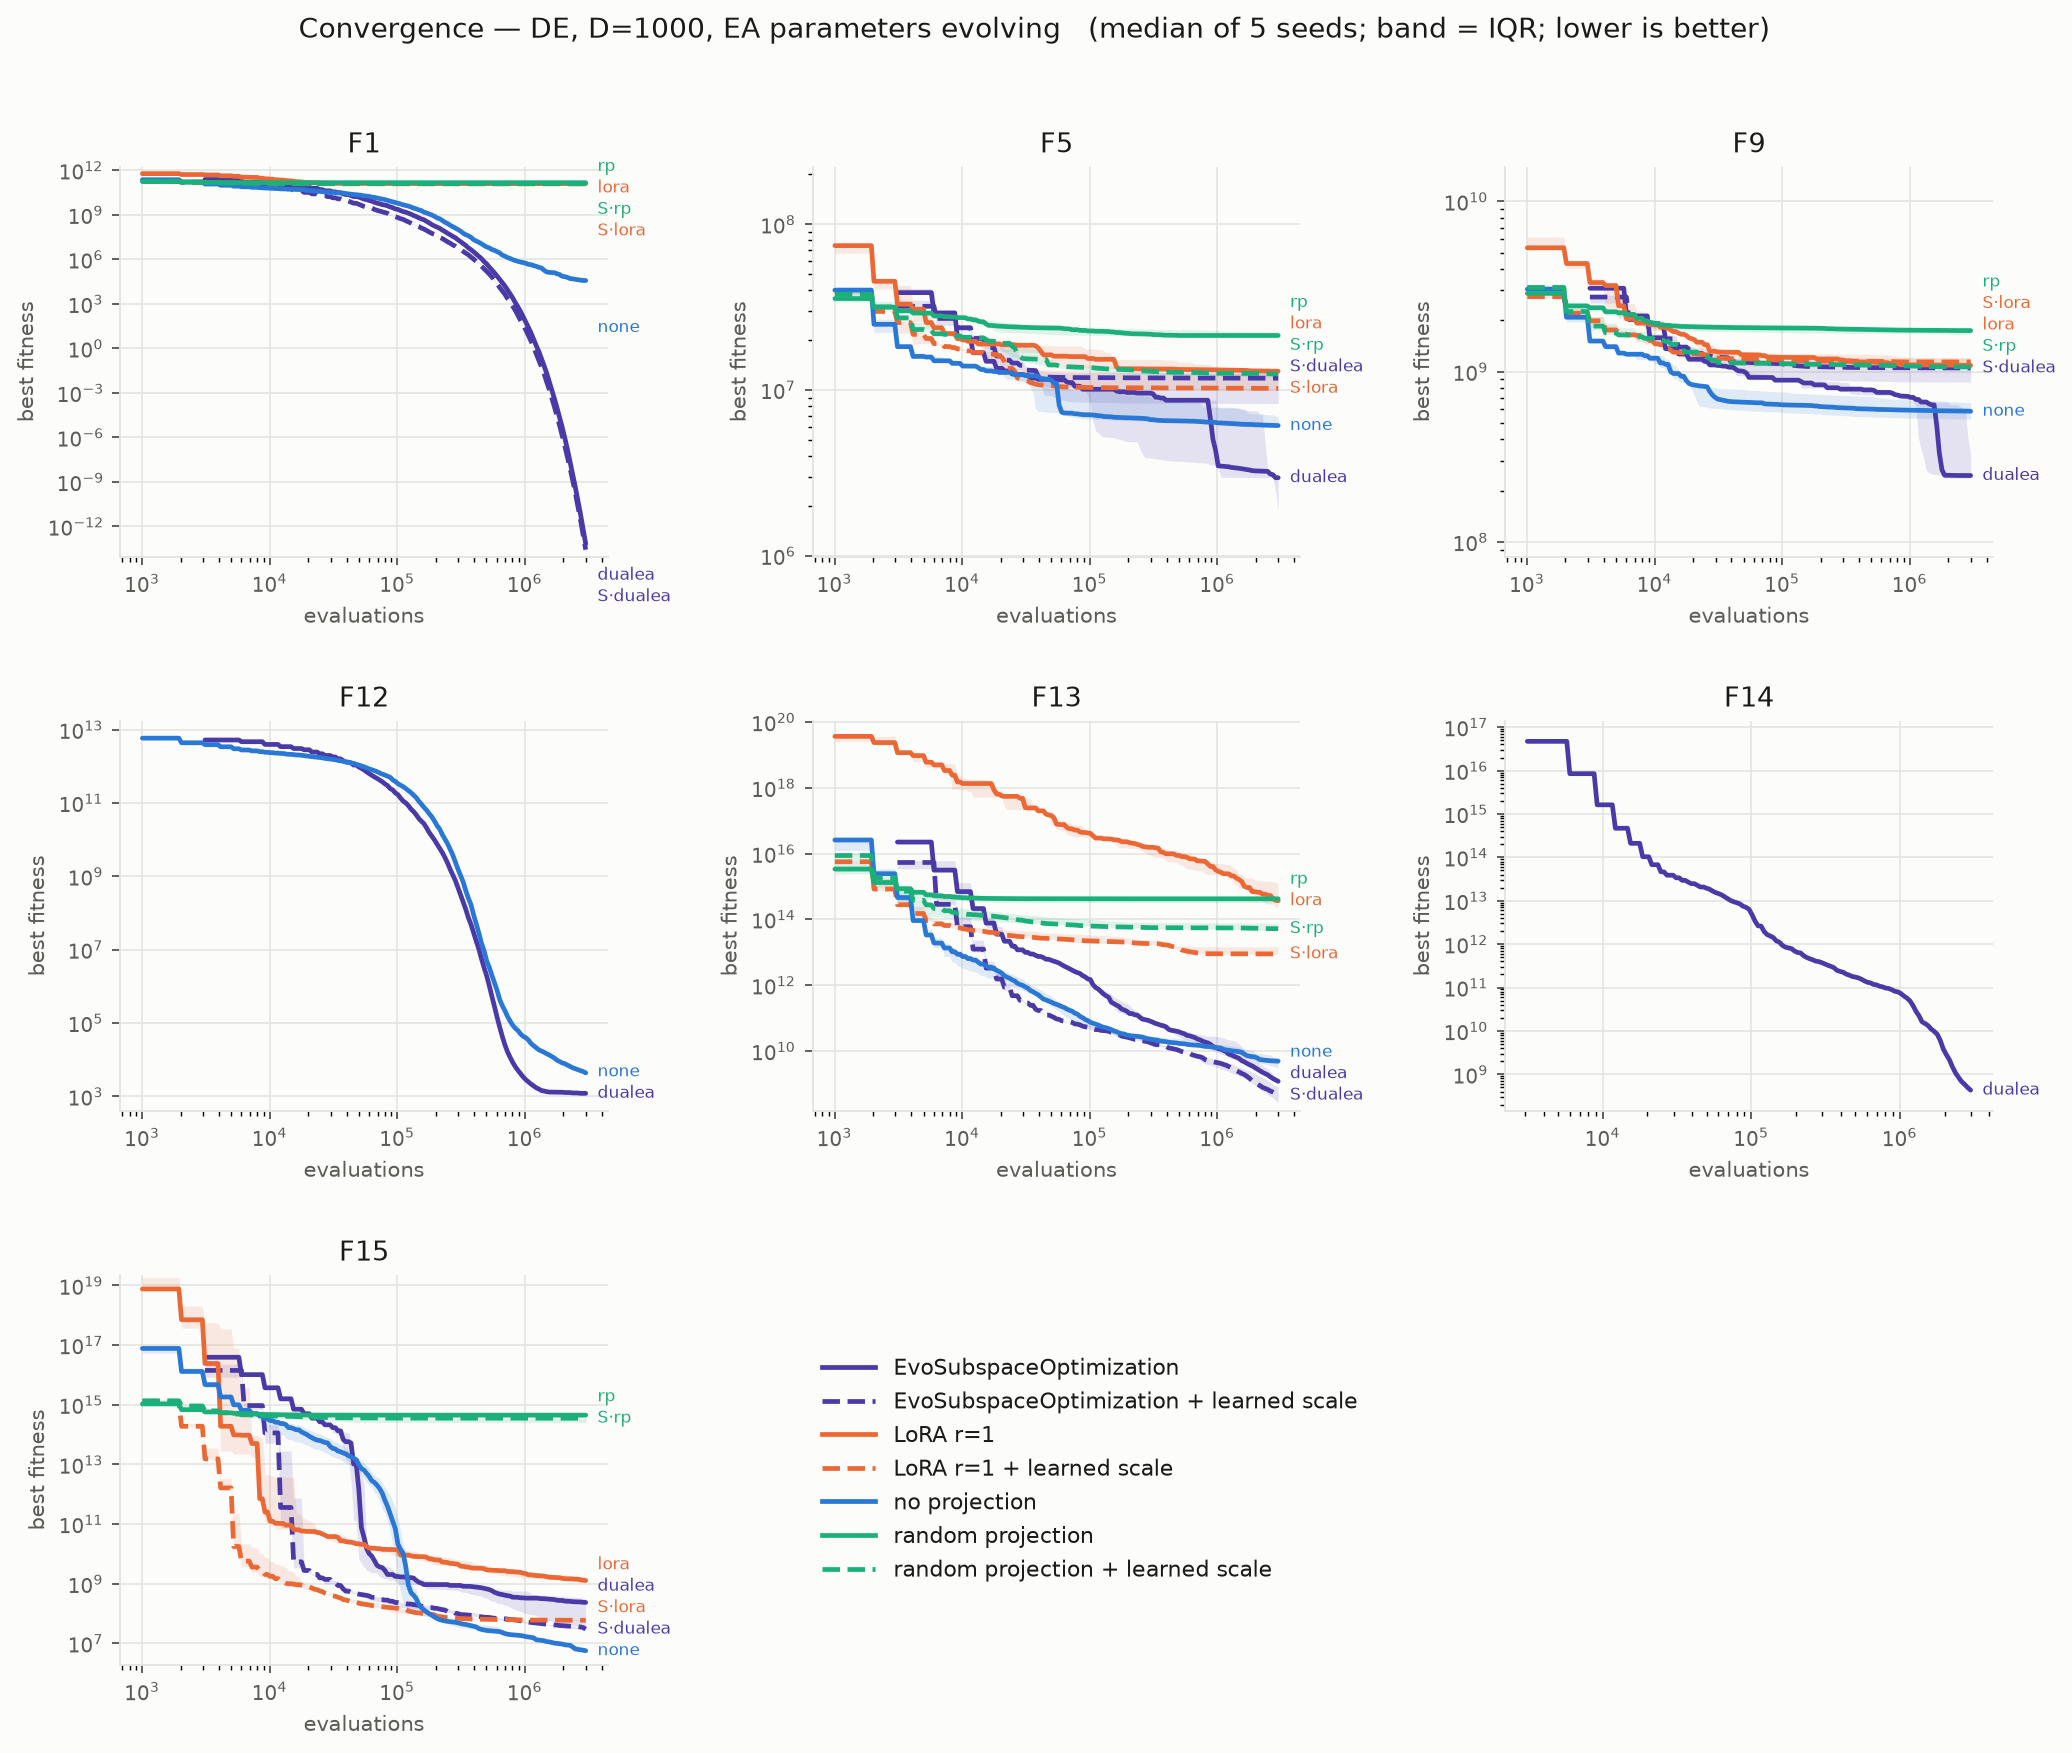
Does self-adapting the optimizer's parameters help?
PyMOO can evolve DE's F and CR per individual. Matched pairs, same seeds and budget, static against self-adaptive:
| Arm | Optimizer | pairs | evolving wins | geo-mean | verdict |
|---|---|---|---|---|---|
| no projection | DE | 26 | 9/26 | 0.45x | static better |
| no projection | PSO | 15 | 14/15 | 2.81x | evolving better |
| EvoSubspaceOptimization | DE | 26 | 17/26 | 25.42x | evolving better |
| EvoSubspaceOptimization | PSO | 25 | 25/25 | 5.48x | evolving better |
It depends entirely on what you are adapting. Self-adaptation hurts plain DE, whose F=0.5, CR=0.9 defaults are already well tuned for this benchmark. It helps the dual-EA substantially. That arm runs two populations in very different regimes, and no single setting suits both.
Does learning a projection parameter help?
We made the projection's output scale a searched decision variable. That costs one extra dimension, and the neutral value reproduces the unscaled map exactly. It addresses a defect we measured: LoRA's factors overshoot the box by about 100×, which clips roughly 95% of coordinates.
| Projection | Optimizer | pairs | scaled wins | geo-mean |
|---|---|---|---|---|
| random projection | DE | 25 | 25/25 | 2.04x |
| random projection | PSO | 25 | 25/25 | 1.89x |
| LoRA r=1 | DE | 25 | 20/25 | 2.31x |
| LoRA r=1 | PSO | 25 | 18/25 | 1.64x |
| EvoSubspaceOptimization | DE | 25 | 15/25 | 1.29x |
| EvoSubspaceOptimization | PSO | 25 | 13/25 | 2.70x |
The gain tracks how much work the projection is doing. Random projection, which must produce the whole solution, improves in every pair. The dual-EA, which is anchored on the full-space best and so already has its reach handled, barely moves.
Is the headline result real? A permutation control
Shuffling the variable order gives back the same function, with the same weights and the same difficulty. All it breaks is any accidental alignment between the benchmark's coordinate ordering and the method's internal reshape. We ran it over all 15 functions and 3 seeds:
| Function | cost of shuffling | effect |
|---|---|---|
| F1 | 1.8e+12x | collapses; all of it was ordering |
| F7 | 5.50x | ordering irrelevant |
| F2 | 1.29x | ordering irrelevant |
| F8 | 1.23x | ordering irrelevant |
| F4 | 1.21x | ordering irrelevant |
| F13 | 1.04x | ordering irrelevant |
| F10 | 1.01x | ordering irrelevant |
| F11 | 1.00x | ordering irrelevant |
| F6 | 1.00x | ordering irrelevant |
| F5 | 0.93x | ordering irrelevant |
| F3 | 0.92x | ordering irrelevant |
| F12 | 0.89x | ordering irrelevant |
| F14 | 0.85x | ordering irrelevant |
| F9 | 0.71x | ordering irrelevant |
| F15 | 0.06x | ordering irrelevant |
F1 collapses by about 1012. Nothing else moves. The median across the other fourteen is 0.998, so the typical function's result moves by a fraction of a percent. One function in fifteen was affected, and it happened to be the headline one.
Optimising the optimizer
A natural extension of the two-population idea is to let one population optimise the optimizer's own parameters rather than more solutions. We implemented that: a second population whose genome is (F, CR), scored by the progress the solution population actually makes under those values.
| Variant | runs | geo-mean best |
|---|---|---|
| over fullspace | 20 | 2.700e+06 |
| over dual-EA | 9 | 3.328e+05 |
It does not pay at this budget. Racing λ candidate parameter sets to advance one costs a λ-fold tax on progress, and the better parameters it finds do not repay that. Over plain DE it landed behind static parameters. Over the dual-EA it beat the evolving baseline in only 3 of 9 runs. We are reporting it as a negative result.
Does it hold at ten times the dimension?
One seed at D=10000, DE. Note this is a different problem family rather than a harder version of the same one: at D≠1000 the benchmark generates its structure from a seed instead of loading the official data files, so these are comparable to each other but not to the D=1000 numbers.
| Function | plain DE | LoRA | random proj. | EvoSubspaceOpt | EvoSubspaceOpt + scale |
|---|---|---|---|---|---|
| F1 | 1.674e+09 | 2.051e+12 | 2.140e+12 | 3.886e+08 | 1.433e+08 |
| F5 | 6.629e+06 | 9.001e+06 | 9.848e+06 | 5.010e+06 | 6.253e+06 |
| F13 | 6.571e+09 | 3.209e+20 | 1.337e+17 | not run | not run |
| F15 | 4.841e+09 | 2.338e+12 | 1.880e+18 | 4.367e+11 | 2.527e+10 |
The ordering is unchanged: the dual-EA variants lead, fixed projections trail badly.
What the controls rule out
F1 is an artifact. Its weights factor as 10^(c(32i+j)) = 10^(32ci) × 10^(cj),
which is exactly the multiplication table the LoRA map produces. It is rank-1 to machine precision. A
permutation control over all 15 functions and 3 seeds showed F1 collapsing by ~1012 when
variables are shuffled, while nothing else moved. F1 is therefore best treated as a special case
rather than evidence of a general effect.
Fixed projections are worse than no projection. Searching a fixed LoRA or random projection in absolute mode lands five to six orders behind plain DE. Clipping to the box turns a rank-4 solution into a full-rank saturated point, destroying the structure the method depends on.
Optimising the optimizer did not pay at this budget. Racing candidate parameter sets costs more evaluations than the better parameters return. Worth revisiting at larger budgets or with a cheaper credit-assignment scheme.